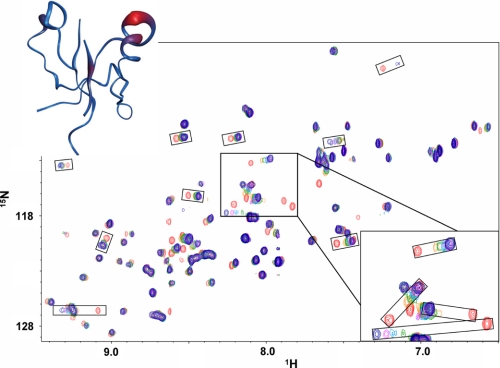
FIGURE 2.
Interaction between the Dvl PDZ domain and compound 3289-8625. Shown are 15N-HSQC spectra of free PDZ domain (red) and PDZ domain with increasing concentrations of compound 3289-8625 (orange, green, cyan, purple, and blue, ligand:protein ratios of 1, 3, 5, 7, and 15). Upper inset, tube diagram of the PDZ domain with the weighted chemical shift intensities from the overlaid NMR spectra shown as regions of differing width and color. The widest (and red) regions contain the residues showing the greatest chemical shift. Lower inset, detail view of several peaks showing large chemical shift.

