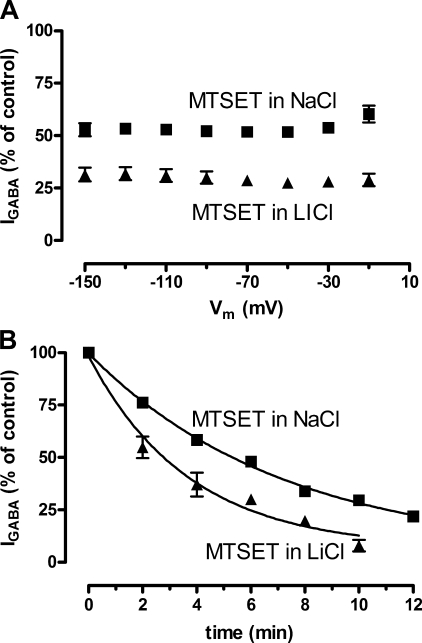
FIGURE 2.
Effect on the GABA-coupled current in GAT-1 expressing oocytes upon incubation with 1 mm MTSET in NaCl buffer and LiCl buffer. A, IGABA plotted as function of membrane potential after incubation with 1 mm MTSET in either NaCl buffer (squares) or LiCl buffer (triangles) for 6 min with the membrane potential held at −90 mV. After incubation in NaCl buffer, IGABA was inhibited to 52 ± 2% (n = 5) and after incubation in LiCl buffer to 29 ± 3% (n = 5). The degree of inhibition was independent of the membrane potential. B, IGABA plotted as a function of time after cumulative incubations with MTSET in either NaCl buffer (squares) or LiCl buffer (triangles) for 2-min periods with the membrane potential held at −90 mV. The lines represent the fits for obtaining the reaction rate constant, k, MTSET incubation in NaCl buffer gave a kNa of 5.2 ± 0.4 min (n = 4) and MTSET incubation in LiCl buffer gave a kLi of 3.0 ± 0.6 min (n = 4).

