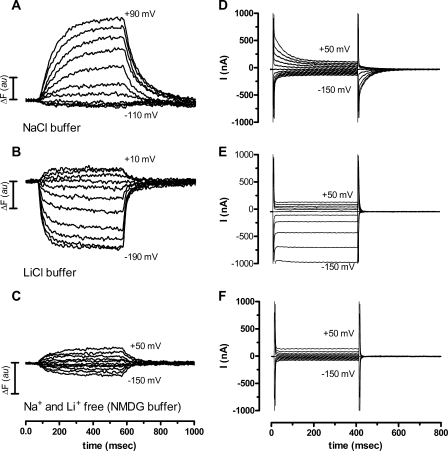
FIGURE 3.
Fluorescence intensity changes and total current records obtained in voltage jump experiments on TMR6M-labeled GAT-1-expressing oocytes. A–C, time course of the voltage-dependent fluorescence signal intensity measured in different external solutions. A, experiment performed in NaCl buffer with the membrane potential (Vm) held at −50 mV (Vh) and then stepped to test potentials (Vt) from +90 to −110 mV in 20-mV increments for 500 ms before returning to Vh. B, experiment performed in LiCl buffer from a Vh of −50 mV to Vt values ranging from +10 mm to −190 mV, otherwise as described above. C, experiment performed in NMDG-Cl buffer from a Vh of −50 mV and Vt values from +50 to −150 mV. All three measurements were obtained in the same oocyte and are representative for n = 5. D-F, total current records from an oocyte expressing GAT-1 and labeled with TMR6M measured in different external solutions with a Vh of −50 mV and subsequent stepping to the Vt value from +50 to −150 mV with 20-mV increments for 400 ms before returning to Vh. D, NaCl buffer. E, LiCl buffer. F, absence of Na+ and Li+ (NMDG-Cl buffer). All three measurements were obtained in the same oocyte and are representative for n = 4. au, arbitray unit.

