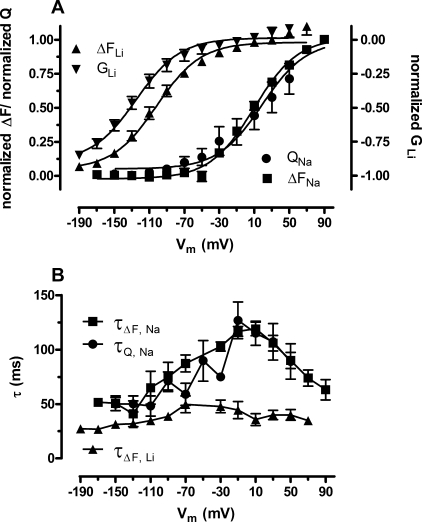
FIGURE 4.
The voltage-dependent fluorescence changes correlate well with the current-generating modes of TMR6M-labeled GAT-1. A, normalized ΔF/Vm relationship for the fluorescence signal in NaCl buffer (ΔFNa, squares) was fitted to a Boltzmann function (solid lines). The V0.5 obtained from the fit was 9.5 ± 2.4 mV (n = 9). The QGAT-Vm relationship for the Na+-dependent transient currents were normalized, plotted (QGAT, circles), and fitted to the Boltzmann equation (solid line) giving a V0.5 of 18.8 ± 7.3 mV (n = 4). Normalized ΔF-Vm relationship for the fluorescence signal in LiCl buffer (ΔFLi, up triangles) was fitted to a Boltzmann function (solid line). The V0.5 obtained for the fit was −101.7 ± 2.8 mV (n = 9). Normalized g-Vm relationship for the Li+ conductance (GLi, down triangles) was also fitted (solid line) to obtain a V0.5 of −125 ± 4.2 (n = 5). B, the τ/Vm relationship for the ΔF in NaCl (τΔF,Na, squares) and LiCl buffers (τΔF,Li, up triangles), and for transient currents in NaCl (τQ,Na, circles). In NaCl buffer, ΔFNa τmax = 19.1 ± 6.3 ms (n = 10) at a Vm of +10 mV and QGAT τmax = 112.1 ± 11.5 ms (n = 5) at a Vm of −10 mV. The time constants for both QGAT and ΔFNa depend on the membrane potential and varied between 50.6 ± 6.9 (at −150 mV) and 119.1 ± 6.3 ms (at +10 mV) (n = 10). In LiCl buffer the ΔFLi τmax = 49.7 ± 7.9 ms (n = 9) at a Vm of −70 mV. The time constants for ΔFLi throughout the tested membrane potentials ranged from 27.3 ± 2.8 to 49.7 ± 7.9 (n = 9).

