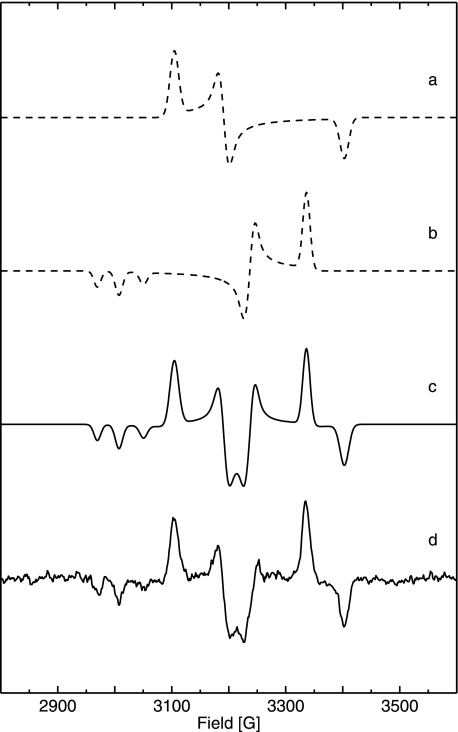
FIGURE 6.
Experimental and simulated EPR spectra of reduced, membrane-attached R. eutropha MBH pH 5. 5 at T = 80 K (for g values see Table 1). Trace a, simulation of Nia-C spectrum. Trace b, simulation of the spectrum of superimposed Nia-L states (inverted intensities) showing three different gx values. Trace c, sum of simulated Nia-C and Nia-L (inverted intensities) spectra. Trace d, experimental EPR difference spectrum (dark minus light) of H2-reduced cytoplasmic membrane at T = 80 K, Experimental conditions are as follows: 10 milliwatt microwave power; microwave frequency 9.56 GHz; 1 mT modulation amplitude, 12.5 kHz modulation frequency.

