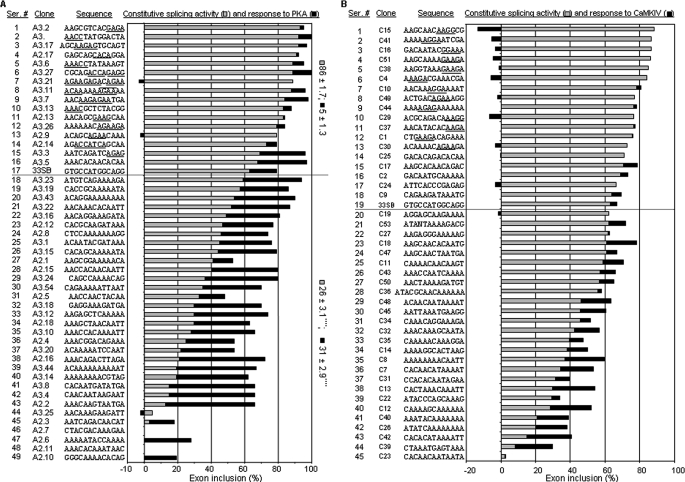
FIGURE 2.
Selected PKA/CaMKIV-responsive elements. A, elements from the selection by PKA, with their serial numbers, clone numbers, sequences, and bar graphs of constitutive levels of exon inclusion (gray bars) and PKA responses (black bars, net changes of percent exon inclusion by PKA) of each clone indicated. The graph is aligned from top to bottom with decreasing constitutive levels of exon inclusion. The average levels of constitutive splicing (±S.E.) or response to PKA of the clones with at least 10% less (silencers) or higher (enhancers) constitutive level than the vector 33SB are indicated to the right of the graph. ****, p < 0.0001 compared with the enhancer group, in two tailed Student's t test. B, elements from the selection by CaMKIV, indicated similarly in A. In both groups, the vector 33SB is also included, as nos. 17 and 19, respectively, above the dotted lines. Motifs similar to the known purine- or A/C-rich enhancers are underlined in both groups.

