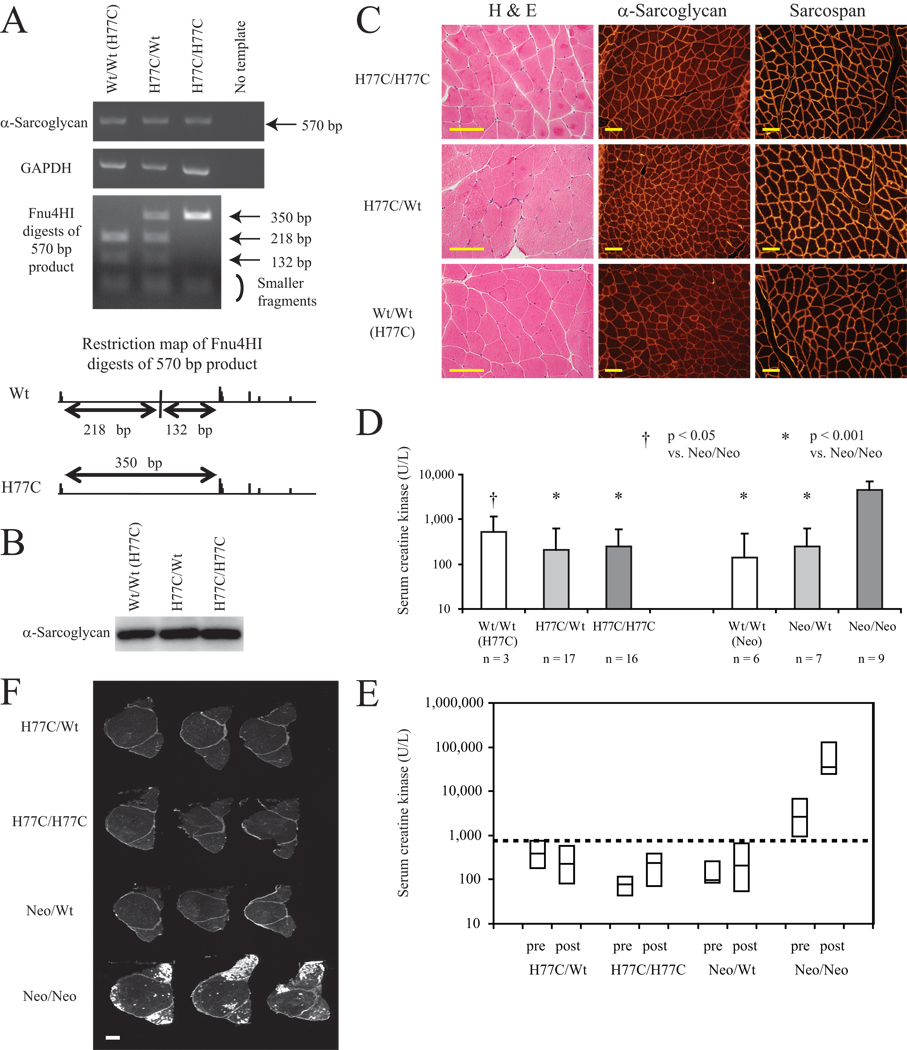
Figure 3. H77C/H77C mice do not develop a muscular dystrophy phenotype.
(A) RT-PCR analysis of skeletal muscle from an H77C/H77C mouse and littermate controls at 15 weeks of age. 570 bp RT-PCR products representing the α-sarcoglycan exon 1 – exon 5 region are shown (top panel), along with a GAPDH internal control (middle panel). Fnu4HI digests of the 570 bp products (bottom panel) indicate that Wt and H77C alleles were equally transcribed. The restriction map of the Fnu4HI sites present in the Wt and H77C 570 bp products is also shown.
(B) Western blot analysis of α-sarcoglycan expression in skeletal muscle from an H77C/H77C mouse and its littermate controls at 55 weeks of age. Note α-sarcoglycan expression in the H77C/H77C mouse.
(C) Quadriceps from an H77C/H77C mouse and its littermate controls H77C/Wt and Wt/Wt (H77C) at 55 weeks of age were analyzed by H&E staining, and by immunofluorescence staining for α-sarcoglycan and sarcospan. H&E panels demonstrate that the H77C/H77C mouse does not exhibit features of muscular dystrophy pathology. α-Sarcoglycan and sarcospan panels show that these proteins are expressed at normal levels and are also localized to the sarcolemma in H77C/H77C mouse as in its littermate controls. Scale bars: 100 µm.
(D) Serum CK levels of H77C littermate sets and Neo littermate sets of mice at 10–21 weeks old. Although the CK level was abnormally high in Neo/Neo mice, this was not the case for H77C/H77C mice. Error bars indicate the SEM of log-CK values, and n equals the number of different mice of each genotype. Statistically significant differences in comparison with Neo/Neo are indicated (†: p<0.05, *: p<0.001).
(E) Box plot of serum CK levels before (‘pre’) and after (‘post’) treadmill exercise. Dotted line: CK value of 750 U/L. Neo/Neo mice showed high basal serum CK levels that increased further after exercise, whereas mice of all other genotypes had serum CK values less than 750 U/L both before and after exercise. n equals 3 for each group.
(F) EBD uptake images of quadriceps samples after treadmill exercise. Each slice was obtained from a different individual mouse. EBD uptake, which is shown as white signal, is clearly visible in Neo/Neo mice but is hardly detected in H77C/H77C mice. n equals 3 for each group. Scale bar: 1 mm.

