
Figure 3.
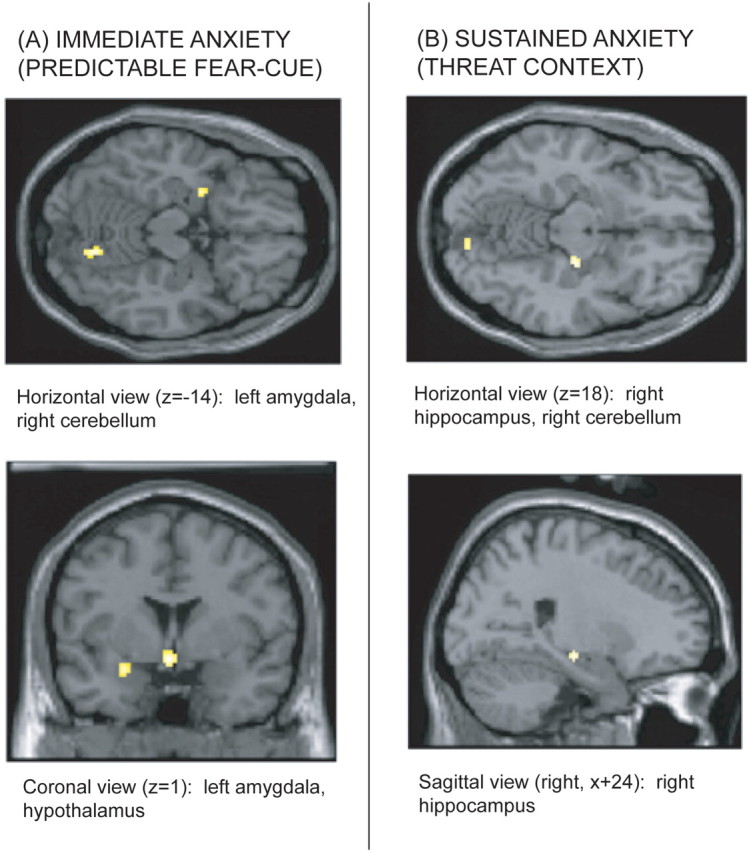
Merged PET–MRI sections illustrating CBF increases in mesiotemporal brain structures displayed on a canonical brain. A, CBF activations during the cue predicting an electric shock at p < 0.005. B, CBF activations during the threat context at p < 0.005