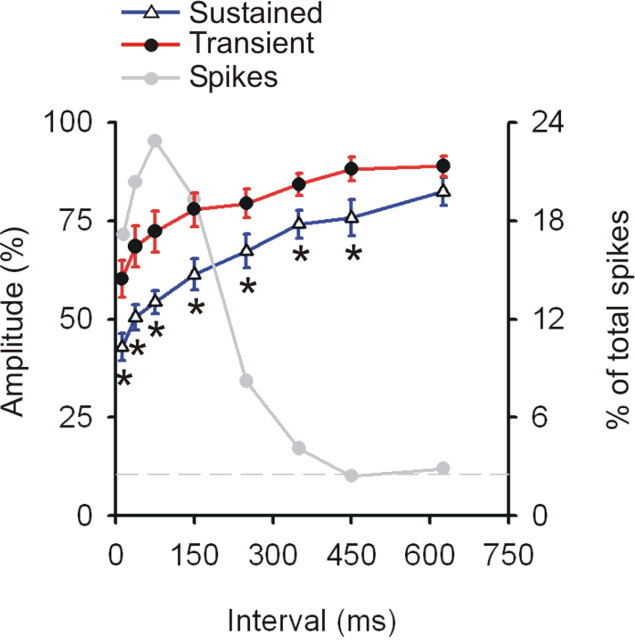
Figure 5.
Temporal dynamics of synaptic depression in sustained versus transient inputs to visual cortex. The degree of reduction in the postsynaptic responses generated by spikes with differing preceding intervals for sustained and transient populations, shown as a percentage of those resulting from spikes with very long preceding intervals (>750 ms). Error bars show ±SEM; each asterisk indicates an interval bin in which the two classes significantly differed at a p < 0.05. The gray line shows the percentage of the total spike train contributing to each bin. Typically, <3% on the total spike train had interspike intervals >750 ms (indicated by the horizontal gray dashed line).

