
Fig. 6. The Xenopus animal cap contains cells fated as anterior neural border.
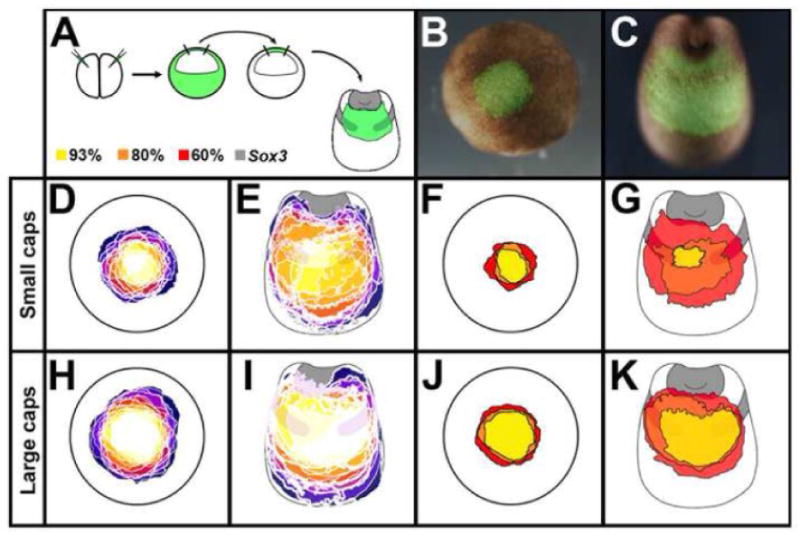
A. Caps from FDX-injected embryos were obtained at stage 8, transplanted to uninjected hosts and analysed for Sox3 at stage 19. B. Example of a transplant at st.8 after 1.5h healing, the same embryo at st.19 (C). D-K. Results of all small (D-G; n=14) and large (H-K; n=15) transplants, each in a different colour, at stages 9 (D,H,F,J) and 19 (E,G,I,K; including Sox3 expression). In D-E and H-I, the regions of overlap are shown in progressively lighter shades, with white indicating a region where all transplanted caps overlap. In F-G and J-K, the areas that receive a cellular contribution from the transplant are in Yellow: 93%; Orange: 80%; Red: 60%.