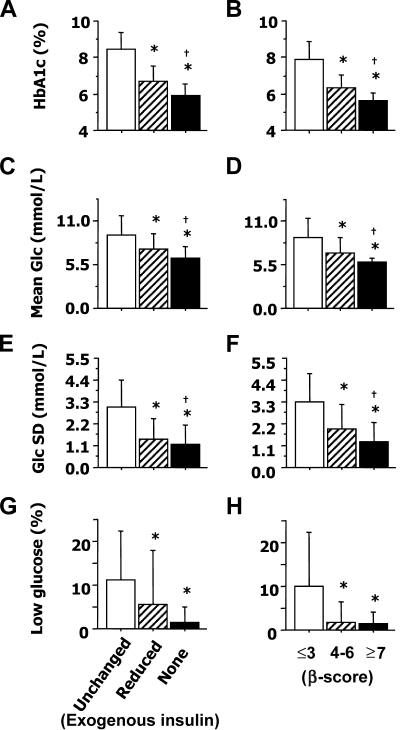
Figure 2.
Graft function and metabolic control in 14 patients before and after islet transplantation. A1C (A and B), mean blood glucose (Glc) (C and D), glucose SD (E and F), and low glucose excursion (time with blood glucose <3.8 mmol/l) (G and H) associated with poor (□), suboptimal (▨), or optimal (■) graft function as reflected by insulin requirements (A, C, E, and G) or by the β-score (B, D, F, and H). *P < 0.05 vs. poor function; †P < 0.05 vs. suboptimal function. The number of separate measurements reflected by each bar is as follows: 20 (□), 14 (▨), and 58 (■) (insulin requirements); 28 (□), 24 (▨), and 40 (■) (β-score). Data are means ± SD.

