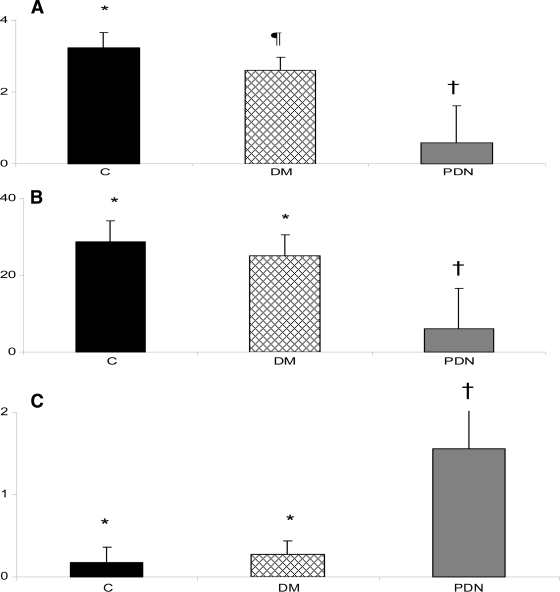
Figure 1.
A: Results of the PCr/Pi ratio. Significant differences were found among all groups. The PCr/Pi was significantly higher in the control group (C) followed by the non-neuropathic group (DM) and was lowest in the neuropathic group (PDN) (* vs. ¶ vs. †: P < 0.0001). B: Results of the total 31P concentration. The 31P concentration was similar in the control and the non-neuropathic group and lower in the neuropathic group (* vs. †: P < 0.0001). C: Results of the foot lipid/water ratio. The ratio was similar in the control and the non-neuropathic group and lower in the neuropathic group (* vs. †: P < 0.0001).

