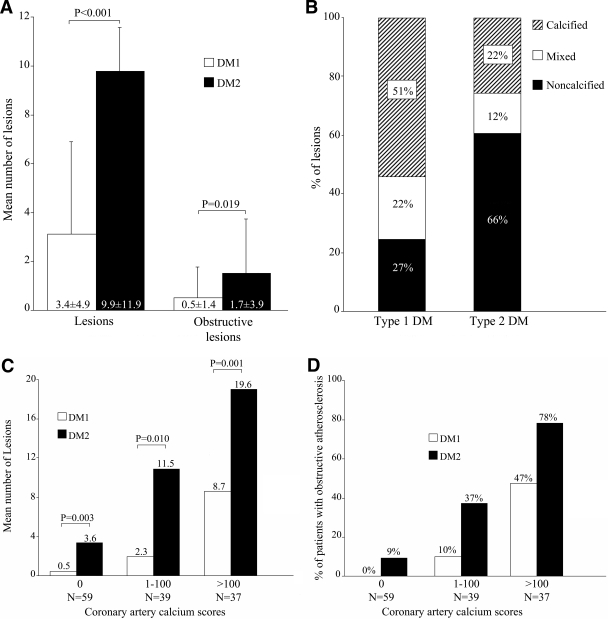
Figure 1.
A: Clustered columns demonstrating average number of lesions and obstructive lesions in type 1 (DM1) and type 2 (DM2) diabetes. A significantly higher mean number of lesions and obstructive lesions were observed in type 2 diabetes. B: Bar graph illustrating plaque phenotype in type 1 and type 2 diabetes. A higher percentage of noncalcified plaques was observed in type 2 diabetes. C: Clustered bar graph illustrating the increase in number of lesions for each CAC score category among patients with type 1 and type 2 diabetes. The plaque burden was significantly higher in type 2 diabetes for each CAC score category. D: Clustered bar graph demonstrating the increase in prevalence of obstructive atherosclerosis for each CAC score category among patients with type 1 and type 2 diabetes. An absence of coronary calcium excluded obstructive atherosclerosis in type 1 diabetes, but not in type 2 diabetes. The prevalence of obstructive atherosclerosis was higher in type 2 diabetes for each CAC score category.

