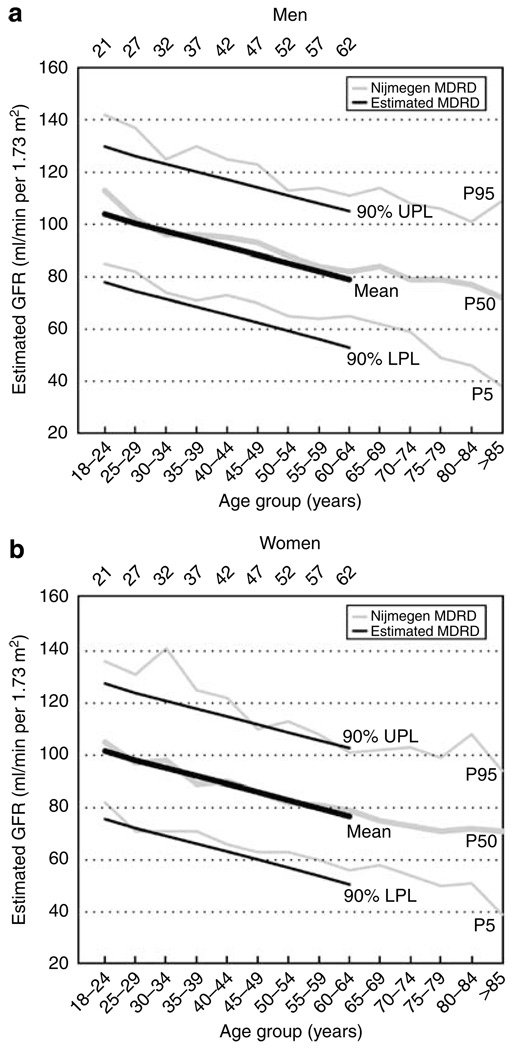
Figure 5. Comparison of estimated GFR in two different cohorts.
Mean, 5th, and 95th percentiles for expected eGFR by the re-expressed MDRD equation in living kidney donors (black lines) and eGFR by the re-expressed MDRD equation in subjects participating in the Nijmegen study28 (gray lines) among different age groups for (a) men and (b) women.

