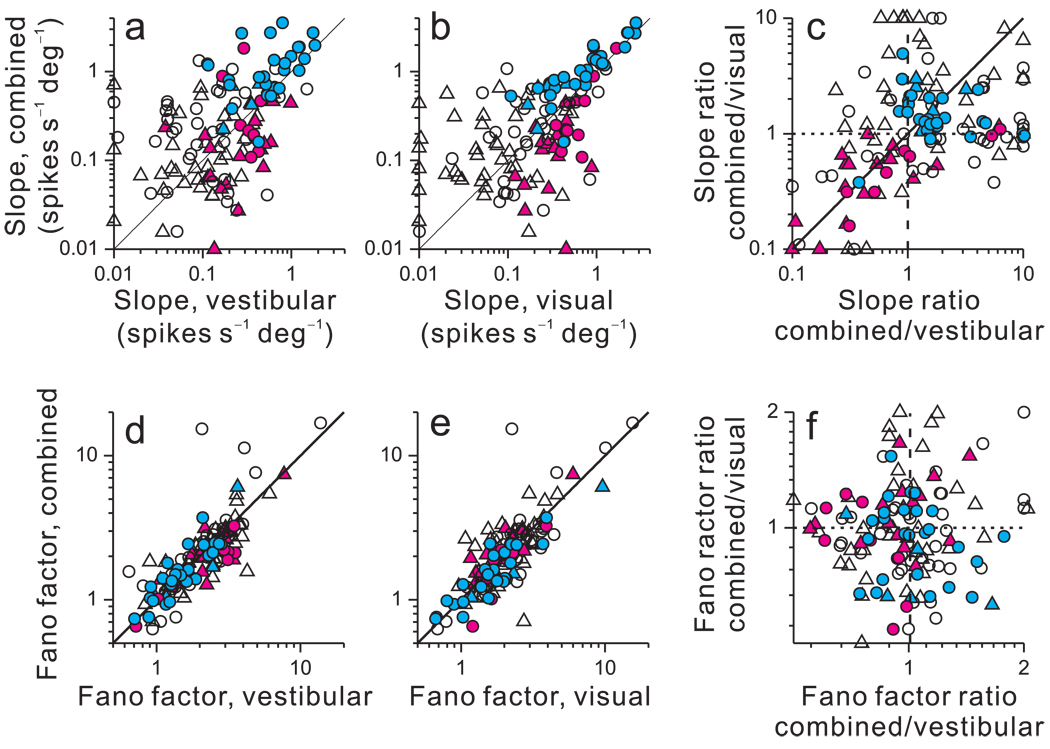
Figure 4.
Effect of cue integration on tuning curve slopes and Fano factors. (a, b) Tuning curve slope in the combined condition is plotted against slope in the vestibular (a) and visual (b) conditions. For CI-congruent cells (cyan), slopes were steeper during cue combination than in either single-cue condition (p<0.001, sign tests). For CI-opposite cells (magenta), slopes were flatter in the combined condition (p<0.02, sign tests). For intermediate cells (black), slopes were not significantly different (p>0.1, sign tests). Data points with slopes <0.01 spikes/s/deg were plotted at 0.01 for clarity. (c) The ratio of combined/visual slopes is plotted again the ratio of combined/vestibular slopes. Data points with values <0.1 (or >10) were plotted at 0.1 (or 10) for clarity. (d, e, f) Variance to mean ratios (Fano factors) are plotted in the same format as a–c. Fano factors were marginally smaller for CI-opposite cells in the combined condition as compared to the vestibular condition (p=0.02, sign test) but not significantly different as compared to the visual condition (p>0.8, sign test). There were no significant differences for all other comparisons (p>0.2, sign tests). Circles: monkey A; Triangles: monkey C.

