Figure 5.
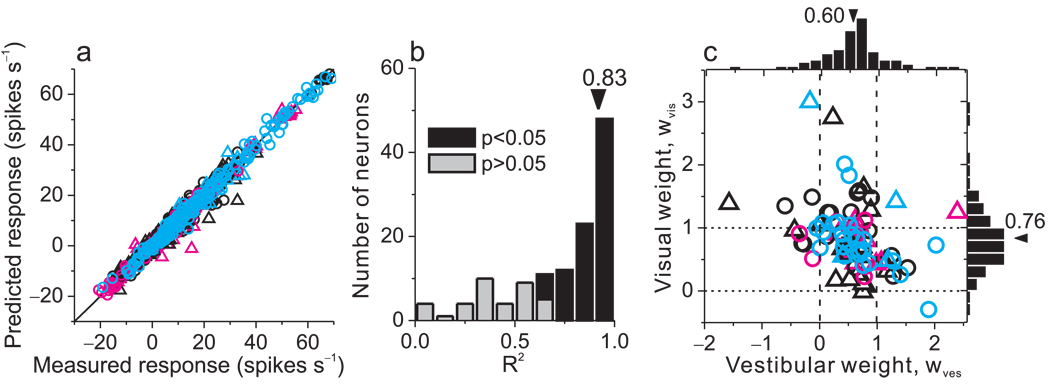
Combined condition responses are well approximated by linear weighted summation. (a) Predicted responses from weighted linear summation were strongly correlated with measured responses in the combined condition (R=0.99, p<<0.001). Each datum represents the response of one neuron at one heading angle; spontaneous activity was subtracted. (b) A correlation coefficient was computed, for each neuron, from a linear regression fit to the predicted and measured responses. The median R2 value was 0.83 and 89 cases (69%) were significant (p<0.05). Three cases with negative (but not significant) R2 values are not shown. (c) Visual and vestibular weights derived from the best fit of the linear weighted sum model for each neuron with significant R2 values (black bars in panel b). Median weights for vestibular and visual inputs were 0.6 and 0.76, respectively, which are significantly smaller than 1 (p<<0.001, t-tests). There is a significant negative correlation between vestibular and visual weights (R=−0.40, p<0.001, spearman rank correlation). Circles: monkey A; Triangles: monkey C.

