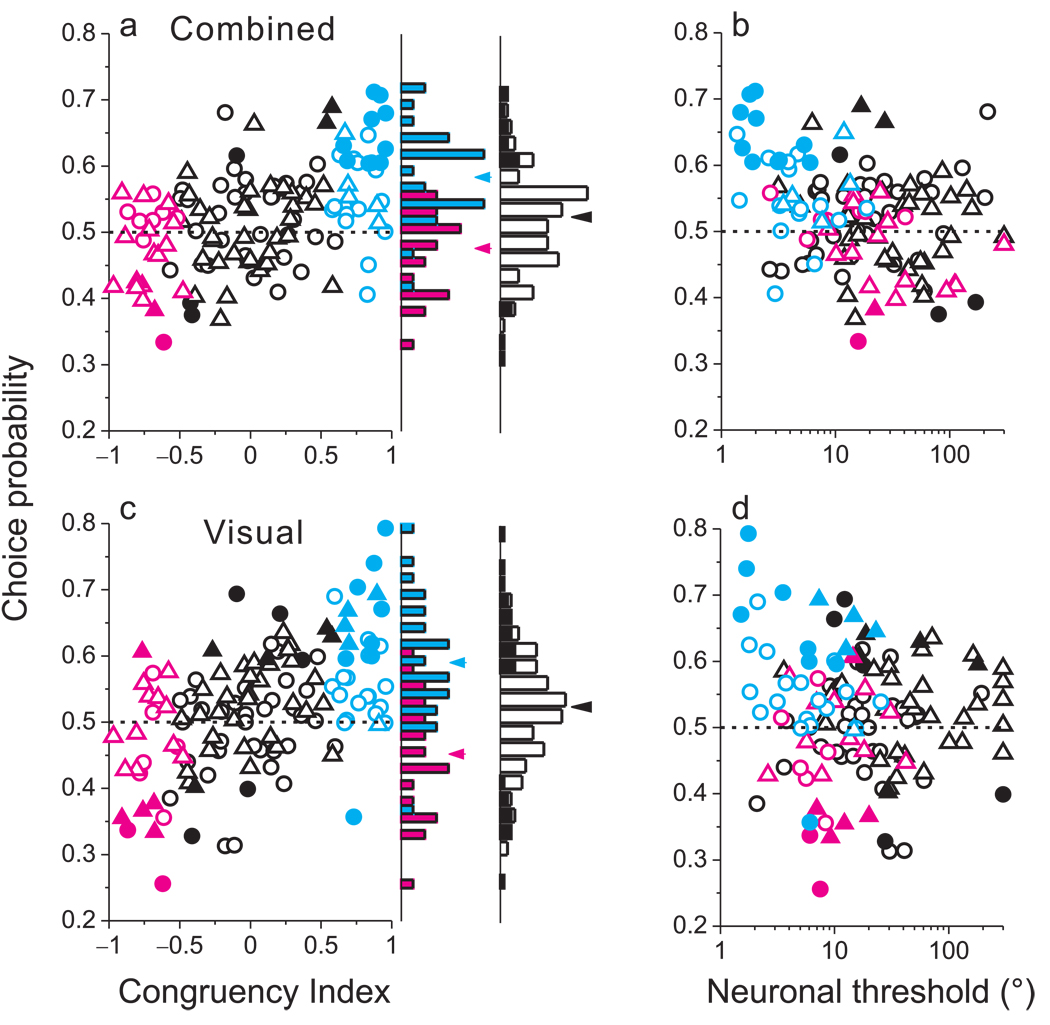
Figure 6.
Correlations between MSTd responses and perceptual decisions depend on congruency of tuning. (a) Choice probability (CP) is plotted against congruency index (CI) for all129 MSTd neurons tested during cue combination (triangles: monkey C; circles: monkey A). Cyan and magenta data points represent ‘CI-congruent’ and ‘CI-opposite’ cells, respectively. Filled symbols denote CPs significantly different from 0.5. The rightmost marginal histogram shows the distribution of CP values for all neurons, with filled bars denoting CPs significantly different from 0.5. The adjacent marginal histogram shows distributions of CP values for CI-congruent (cyan) and CI-opposite (magenta) cells. (b) CP is significantly anti-correlated with neuronal threshold during cue combination (R = −0.31, p<0.0003, Spearman rank correlation). (c) CPs in the visual condition, presented in the same format as panel a. CP was significantly correlated with CI (R=0.51, p<<0.001). (d) Visual condition CPs plotted as a function of neuronal thresholds.

