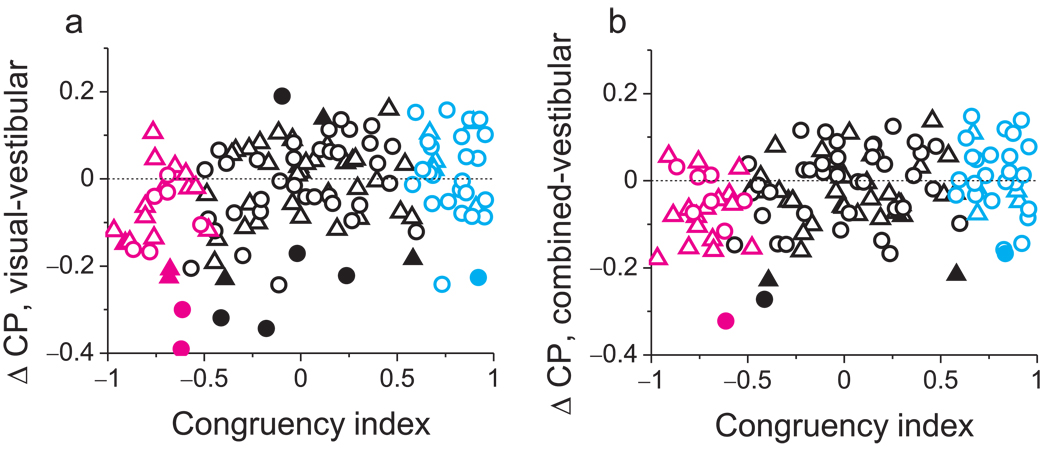
Figure 7.
Summary of effects of congruency on CP values across stimulus conditions. (a) The difference in CP between visual and vestibular conditions is plotted, for each neuron, against CI Filled symbols denote differences in CP that are significantly different from zero for individual neurons. Circles: monkey A; triangles: monkey C. Cyan and magenta data points represent ‘CI-congruent’ and ‘CI-opposite’ cells, respectively. (b) Differences in CP between the combined and vestibular conditions are plotted as a function of CI.

