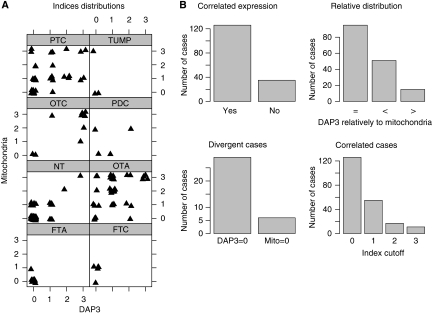
Figure 3.
Tissue array were constructed with 100 thyroid tumours and 61 normal thyroid samples. Immunohistochemistry analysis was carried out using the standard avidin–biotin peroxidase technique with either a monoclonal anti-DAP3 or a mitochondrial antigen antibody as primary antibodies. Antigen expression is coded from 0 (no staining) to three (strong staining). (A) Distribution of the number of positive cells for DAP3 and the mitochondrial antigen analysed. Considering the distribution of the expression values of DAP3 and the mitochondrial antigen in the different types of tumours, the correlation between the two proteins expression assessed by the Spearman's test shows a significant and positive correlation (ρ=0.65, P<0.01). (B) Statistical analysis of the expression correlation between DAP3 and a mitochondrial antigen in tumours. Statistical analysis of the distribution of the values is represented in histograms. Expression values of the two antigens were considered correlated when they were both non-null and both equal to zero (correlated expression). Divergence was defined when one antigen showed a non-null expression, whereas the other antigen was not expressed (divergent cases). The relative distribution of the DAP3 antigen expression is shown when it is equal (=), lower (<) or greater (>) than the mitochondrial antigen (relative distribution). The number of correlated cases is shown for several expression value cutoffs (correlated cases).

