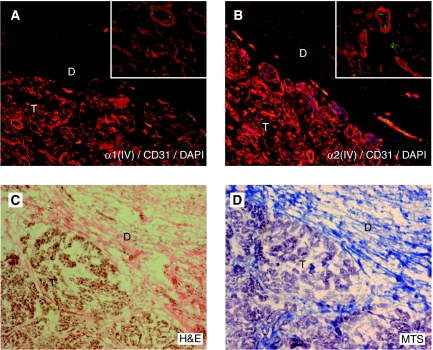
Figure 2.
Expression of type IV collagen in pancreas cancer. (A, B) In pancreas cancer tissue α1(IV)- and α2(IV)-chains are strongly expressed (in red) in the tumour stroma (marked T) and in the VBM, whereas the expression is low in the surrounding desmoplastic area that contains an abundance of fibrillar collagens (marked D). Blood vessels are visualised by the endothelial cell marker CD31 (in green) and cell nuclei by DAPI (in blue). Insets show a close-up of the tumour stroma. (C, D) Light microscopy images stained with H&E (C) and MTS (D) of the corresponding areas in pancreas cancer. In (D) MTS the collagen fibres are stained blue. Magnification × 20 in all panels and × 40 in inserts.

