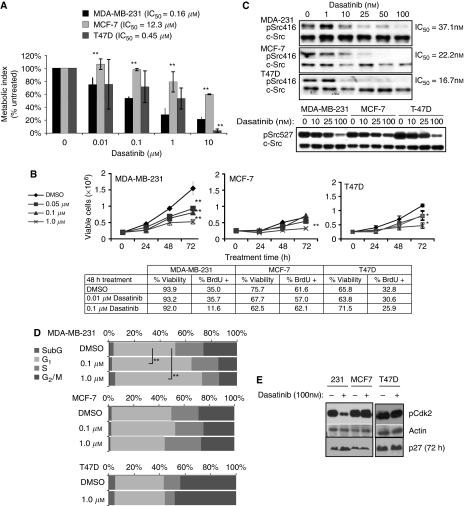
Figure 1.
Inhibition of cell growth and G1 progression in dasatinib-sensitive breast cancer cells. (A) Cells were grown in 96-well plates with complete medium, then treated with dasatinib for 48 h before analysis by MTT assay. Results are shown as a percent of DMSO-treated samples and represent the mean of four independent assays with 4–5 replicates each. Error bars are standard error of the mean (s.e.m.). Asterisks denote significance in comparison to MDA-231 sample within each treatment dose. (B) Cells were plated in 6-well dishes with complete medium and treated with dasatinib for 48 h. Samples were collected at indicated time points and counted with a hemocytometer. Viability was determined by trypan blue exclusion. BrdU positivity was analysed by flow cytometry. (C) Cells were treated with DMSO or dasatinib for 2 h and whole cell lysates probed for phospho-Src (Y416 or Y527), stripped, and reprobed for c-Src. Response for each dose was calculated as the ratio of phospho-Src to total-Src. IC50 was calculated by best-fit regression of data points. (D) Cells were treated for 48 h with DMSO, 0.1 or 1.0 μM dasatinib, fixed, and stained with propidium iodide, and analysed by flow cytometry for cell cycle distribution. (E) Whole lysates of cells treated with 100 nM dasatinib for 2 h (72 h for p27 blot, as indicated) were probed for phospho-Akt substrate, actin, and p27. Results are representative of at least three independent experiments. *Indicates P<0.05; **indicates P<0.01.

