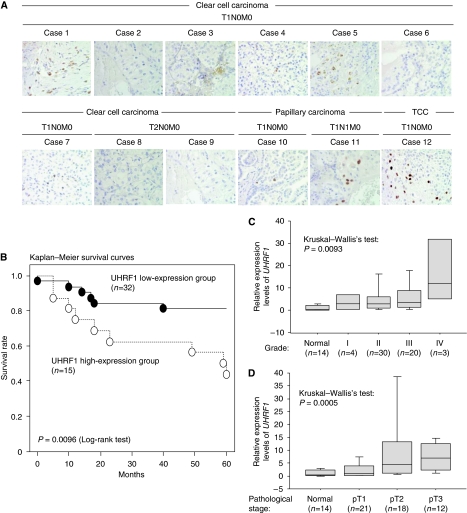
Figure 3.
Expression of UHRF1 in kidney cancer. (A) UHRF1 expression in kidney cancers examined by immunohistochemistry. Clinical information of each individual is shown in Supplementary Table S3. Magnification level is × 400. (B) Expression levels of UHRF1 correlate with 5-year survival rate of kidney tumours detected by TaqMan qRT–PCR. Patients were categorised into two groups by expression levels of UHRF1. The UHRF1 high expression group is a group, which expresses UHRF1 eight or more (⩾8) and the low expression group is a group, which expresses UHRF1 less than eight-fold (<8) compared with average of UHRF1 expression level in normal kidney from 21 individuals as 1.0. In the result of Kaplan–Meier survival analysis, the UHRF1 high expression group showed significantly poor survival rate compared with the UHRF1 low expression group (P=0.0096: Log-rank test). β2-microglobulin was used for normalisation. (C) Expression levels of UHRF1 correlated with histological grade of kidney tumours detected by TaqMan qRT–PCR. Patients were categorised into four groups by histological grade (1 to 4). High expression of UHRF1 correlated with advanced grade (P=0.0093: Kruskal–Wallis’s test). β2-microglobulin was used for normalisation. (D) Expression levels of UHRF1 correlated with pathological staging and histological grade of renal cancers detected by TaqMan qRT–PCR. Patients were categorised into three groups with pathological stages, pT1 to pT3. High expression of UHRF1 correlated with advanced stage (P=0.0005: Kruskal–Wallis’s test). β2-microglobulin was used for normalisation.

