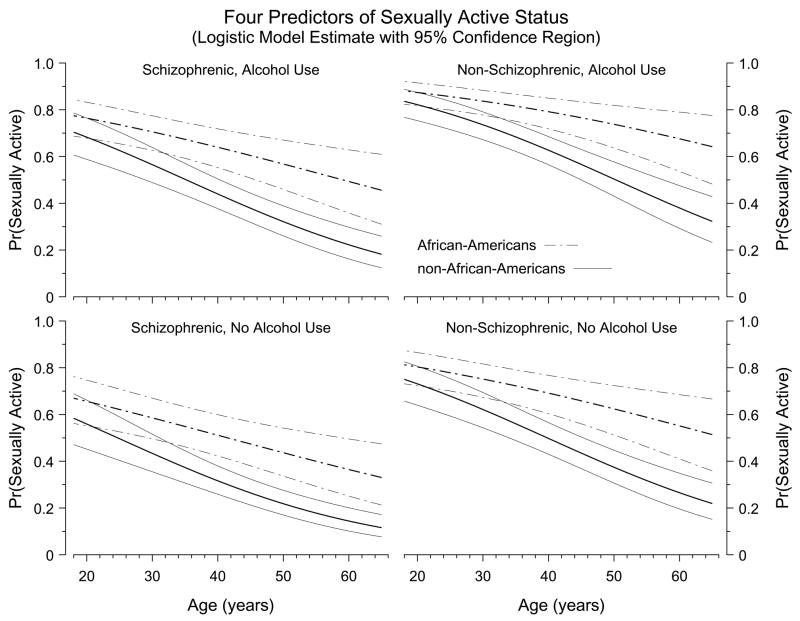
Figure 1.
Each panel displays the probability of being Sexually Active during the past year as a function of participant age. The thick lines plot the estimated probability of risk and the thin lines form pointwise 95% confidence bands around that estimate, as derived from the six-predictor logistic regression model; dashed lines show estimates for African-American participants, solid lines for non-African-Americans. The four panels correspond to the possible combinations of two indicator variables in the regression model: schizophrenic diagnosis (Yes/No) and self-reported alcohol use within the past year (Yes/No). Thus, the figure portrays four of the six predictors in the logistic regression model (ROC curve area = 0.722). The predictors not represented in the figure are DAST risk classification score and residence type (supervised vs. unsupervised); adding those two predictors increases the ROC curve area to 0.734.

