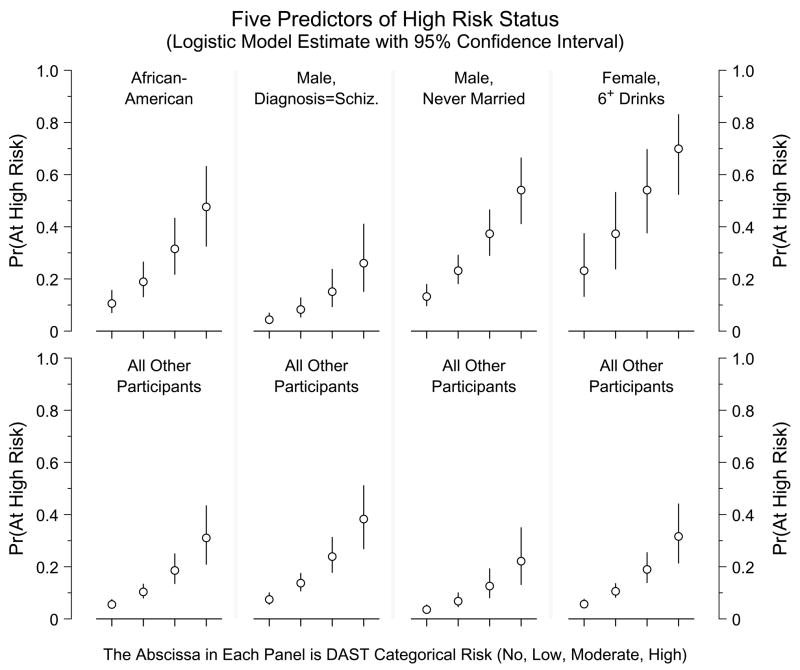
Figure 2.
The open circles plot the estimated risk probability for the High Risk marker, as derived from the five-predictor logistic regression model; the attached vertical lines portray pointwise 95% confidence intervals. The abscissa is DAST risk status, one of the five predictors in the model. Each of the other predictors is an indicator variable distinguishing two subsets of participants; the upper panel in each section shows predictions for one subset, the lower panel for the other subset of participants. (Except for the second section, the upper panel represents increased probability of High Risk.) First section: African-Americans vs. all others; second section: males with diagnosis of Schizoprenia vs. all others; third section: males with “Never married” or “Unknown marital status” vs. all others; fourth section: females who reported having had six or more drinks on a single occasion vs. all others. The area under the ROC curve is 0.761 using all five predictors; the strongest single predictor is the DAST classification (ROC area = 0.670).

