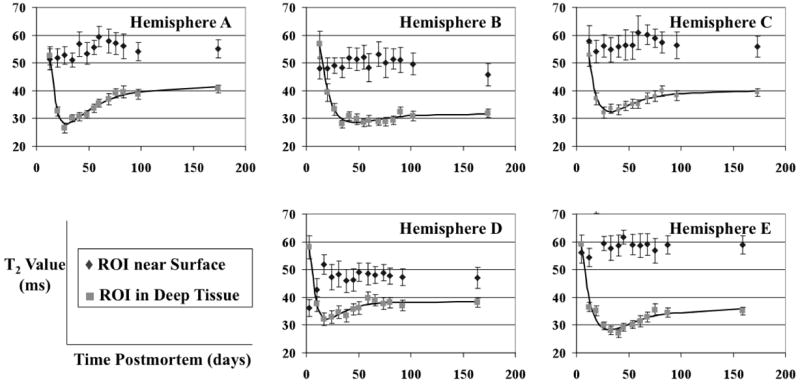
Figure 3.

T2 values in ROIs near the surface of the hemispheres (◆) and in deep tissue (■), plotted over time, for all five brain hemispheres. The solid lines represent the behavior of T2 values in deep tissue as modeled by the function T2est = Aexp(-c1t) + B[1 - exp(-c2t)]. The error-bars show the standard deviation of the measurements.
