
Fig. 3.
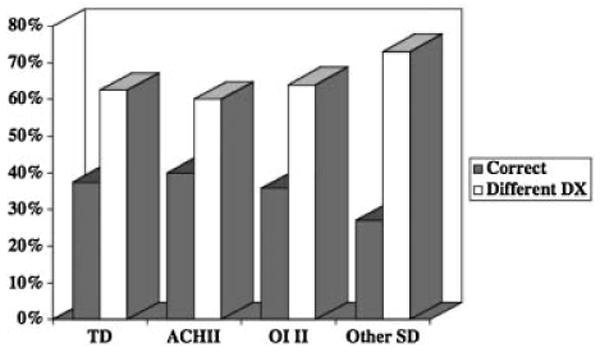
Bar graph showing the percent correlations between prenatal ultrasound versus radiographic diagnoses for specific skeletal dysplasias in the retrospective analysis. TD, thanatophopric dysplasias, ACH II, achondrogenesis 2, OI II, osteogenesis imperfecta type 2, other SD, other skeletal dysplasias.