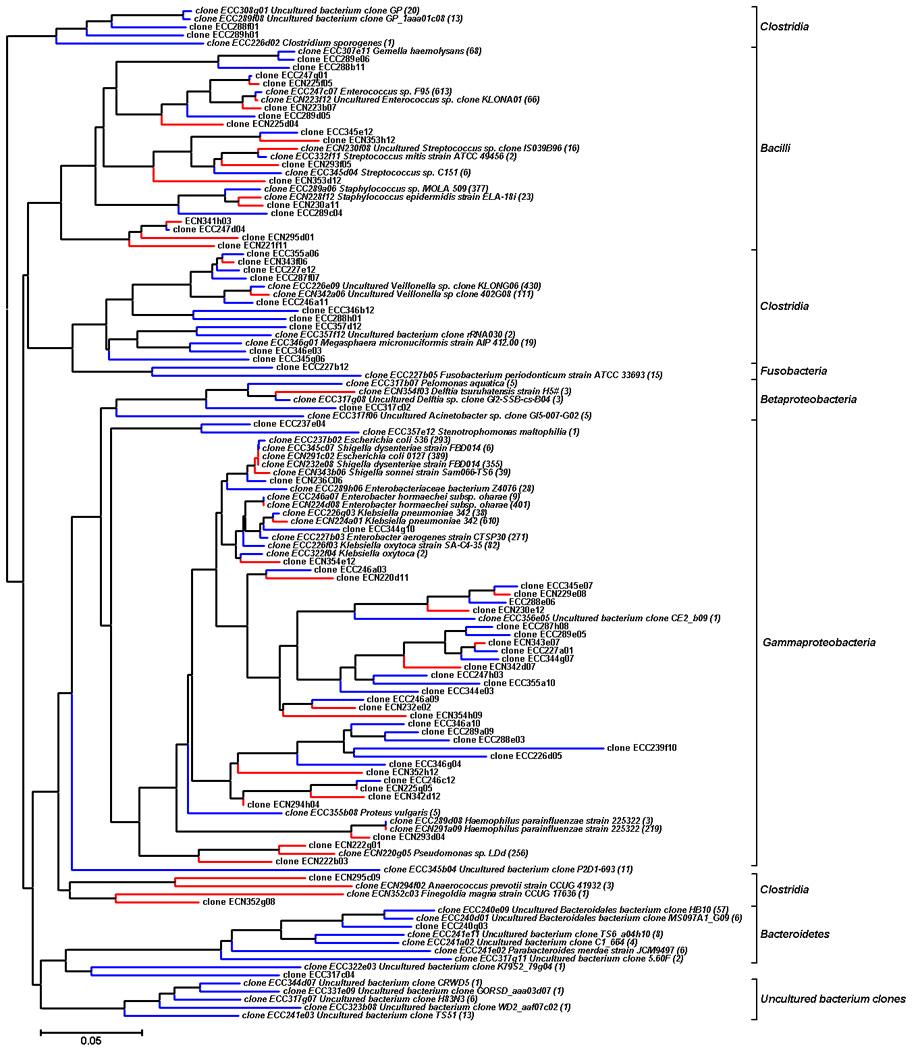
Figure 3. Phylogenetic relationships among the OTUs detected in fecal samples both from control and NEC infants.

The representative 125 clone numbers are listed in the tree. Clones labeled with ECC on blue branches were obtained from control infants. Clones labeled with ECN on red branches were obtained from NEC infants. Sequences with a more than 99% match are given the name of the matched species in GenBank and labeled with the number of identified clones in the libraries. The accession number, the nearest neighbor, the level of similarity and the number of clones in the clone library for each sequence are shown in Supplementary Table 1 and Table 2. Bootstrap values are based on 1000 replications and values above 50% are labeled. OTUs, operational taxonomical units.
