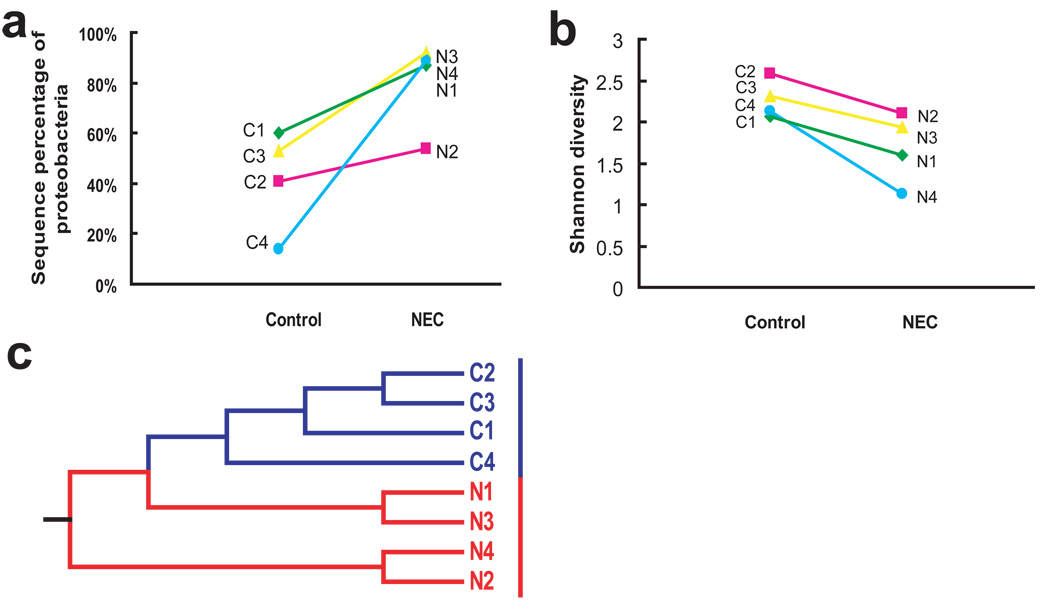
Figure 4.
Decreased diversity (a) and increased abundance of Proteobacteria (b) are demonstrated between samples collected from infants with and without NEC in samples from 4 sets of twins. (c) Dendrogram demonstrating that even for twin pairs, NEC patients (N1–N4, red) clustered together and distinctly separated from their healthy cohorts (C1–C4, blue) by UniFrac analysis. NEC, necrotizing enterocolitis.

