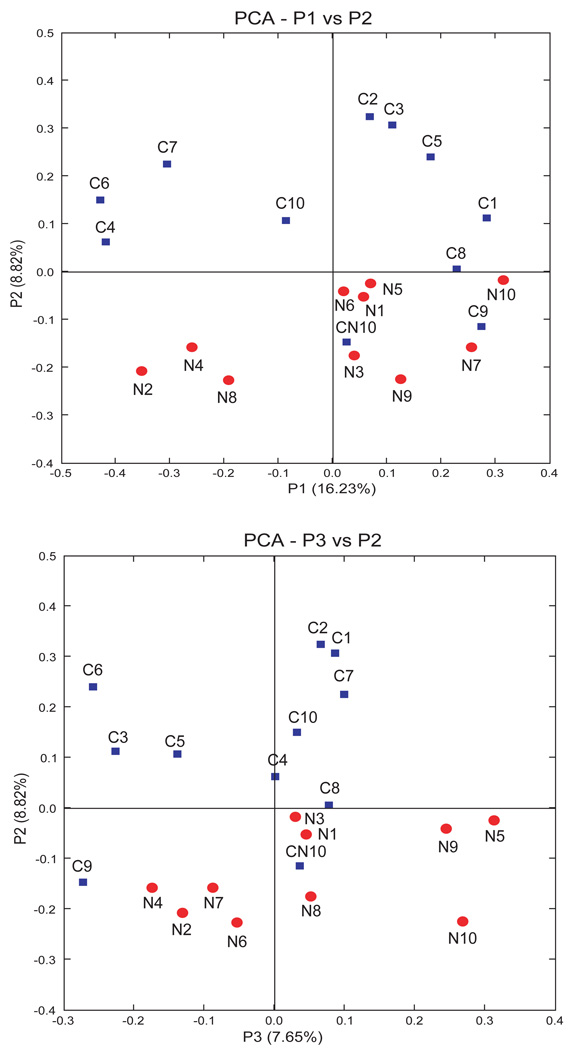
Figure 5. Principal coordinate analysis (PCA) of sequence libraries.
Samples collected from infants without NEC (control) are represented by squares (blue); samples from infants with NEC are represented by circles (red). Distribution of samples collected from infants with NEC was distinct from that collected from control infants. Samples C9 and CN10 which were collected from control patients who later developed NEC, notably clustered with the NEC group. NEC, necrotizing enterocolitis.

