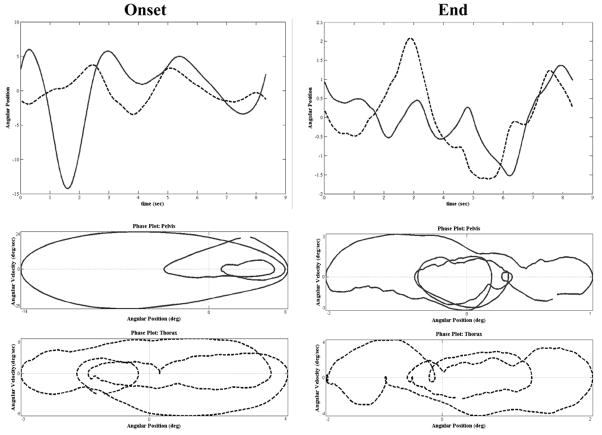
Figure 3.
Example of time series data for pelvis and thorax at the onset and end of the study as well as the corresponding phase portraits. Phase portraits provide a qualitative picture of the organization of the neuromuscular system. Solid line represents the pelvis while the dotted line represents the thorax.

