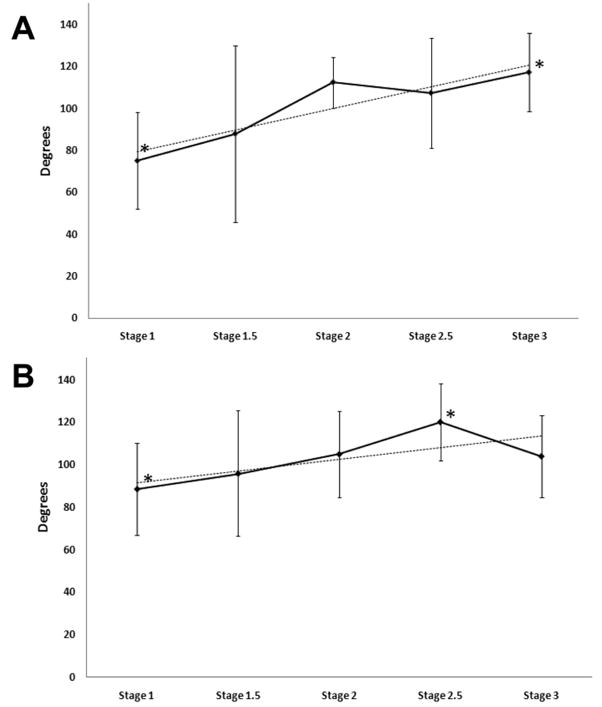
Figure 4.
A. Group mean values and SE for MARP in the sagittal plane. B. Group mean values and SE for MARP in the frontal plane. The dotted line indicates statistically significant linear trend. * indicates significant differences. The sample size for each stage was the following: Stage 1 (6), Stage1.5 (3), Stage 2 (4), Stage 2.5 (7), Stage 3 (10).

