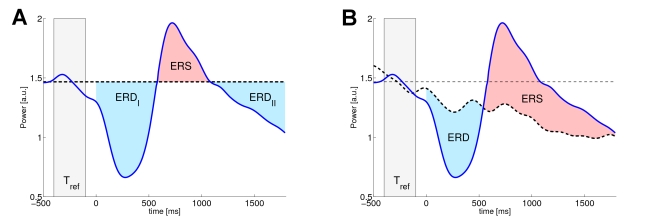
Figure 1. Comparision of conventional and generalized ERD.
Conventional ERD (panel A) measures the deviation of the event-related dynamics (blue solid line) from a constant baseline level (black dashed line) that is obtained as averaged power in the reference period  . The generalized ERD (gERD), depicted in panel B, defines ERD/S in relation to a dynamic reference (black dashed) which is obtained from catch trials. The reddish and bluish areas of both panels indicate the resulting periods of ERD and ERS, respectively.

