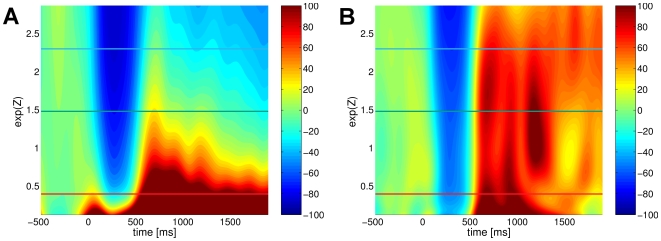
Figure 5. Comparision of both methods for estimating state conditional
 ERD induced by somatosensory stimuli.
The figure contrasts the conventional (panel A) with the generalized state conditional ERD (panel B). The vertical axis represents the explanatory factor, i.e., the level of pre-stimulus  activity. The estimated ERD/S are depicted using a color coded scheme, where blue dyed areas correspond to periods of ERD while red dyed areas indicate an ERS. The additionally highlighted horizontal lines correspond to the individual panels of Fig. 6.

