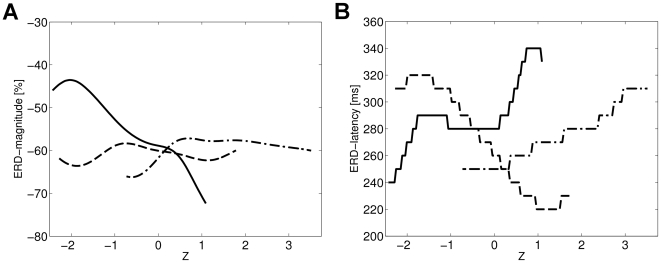
Figure 7. Estimated functional relationship between the ERD characteristics and the explanatory factors.
Panel A shows the estimated dependency of ERD magnitude on the three explanatory factors, i.e., on the local pre-stimulus  (solid), on the pre-stimulus activity of occipital
  (dash-dotted) and on the strength of the preceding ERS response (dashed). The estimated relationship between ERD latency and the three factors is depicted in panel B.

