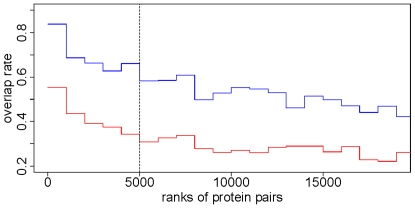
Figure 2. Annotation overlap rate with GO and KEGG as the benchmarks.
Protein pairs are ranked by P 1. The top-ranked 20,000 pairs are divided equally into 20 bins. In each bin (1,000 protein pairs), we calculated the GO overlap rate and the KEGG overlap rate. The red curve stands for the GO overlap rates and the blue one stands for the KEGG overlap rates. The dashed line is the cutoff at the 5,000th protein pair. The correlation coefficient between the two groups of overlap rates is 0.928 (P<0.0001).

