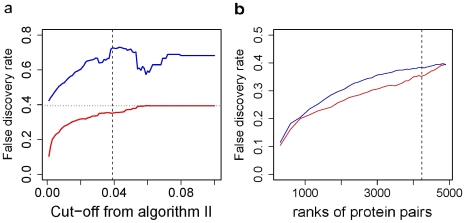
Figure 3. Algorithm II decreased the false discovery rate (FDR) of our predictions.
(a) For the top 5,000 protein pairs ranked by P 1, each cutoff value from P 2 (on the x axis is the quantile of P 2 we used as the cutoffs) divided them into two groups: Group I (red line), whose P 2 was better than the cutoff, and Group II (blue line), whose P 2 was worse than the cutoff. In this plot, the maximal difference between the two groups is at 0.039 (vertical dashed line), which corresponds to the cutoff of −30.03 from Algorithm II. The horizontal dotted line stands for the FDR (0.40) of the top 5,000 protein pairs ranked by P 1. (b) The blue line (Group III) shows the FDR of protein pairs ranked by P 1 only (x axis stands for the amount of selected top protein pairs), and the red line (Group I) shows the FDR of the significant protein pairs selected by P 1 and P 2 together.

