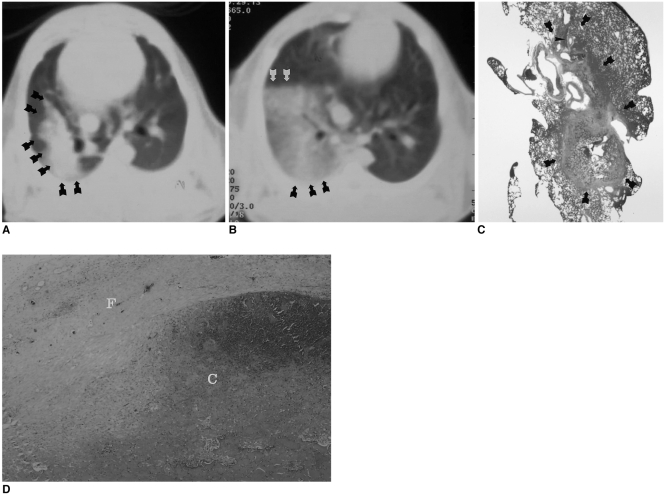
Fig. 3.
Follow-up CT scans of a rabbit in the subacute subgroup obtained through a radiofrequency-ablated lesion both immediately and two weeks after treatment.
A. CT scan obtained immediately after the procedure depicts a large opacity involving the right lower lobe of the lung (arrows).
B. Follow-up CT scan obtained two weeks after the procedure shows markedly decreased right lung volume, as well as hazy opacity induced by RFA (arrows).
C. Microscopic image (×1) demonstrates marked fibrotic change involving both the segmental bronchi (arrowheads) of the right lower lobe and the ablated lesion (arrows).
D. Microscopic image (×40) reveals central coagulation necrosis (C) and formation of a thick peripheral fibrous capsule (F).

