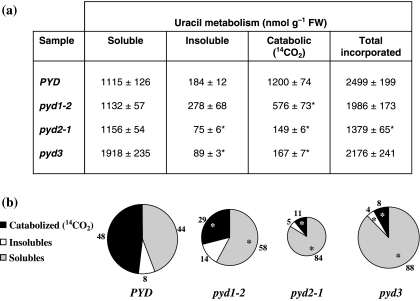
Fig. 7.
[2-14C]-Uracil (Ura) metabolism by Arabidopsis seedlings. (a) Total incorporated label and distribution within catabolic (14CO2), perchloric acid (PCA)-soluble (nucleobases, nucleosides, nucleotides, nucleoside diphosphate sugars) and PCA-insoluble (DNA and RNA) pools. Data are expressed on a nmol Ura g−1 fresh weight basis and represent the means ± standard error of three biological replicates. Unpaired two-tailed t-tests were used to compare labelling data for wild-type PYD and pyd mutant plants. Significant differences with P < 0.05 are labelled with an asterisk. (b) Metabolite labelling as a percentage of total incorporated Ura. The size of the circle represents the amount of Ura that was taken up by the respective seedling culture.

