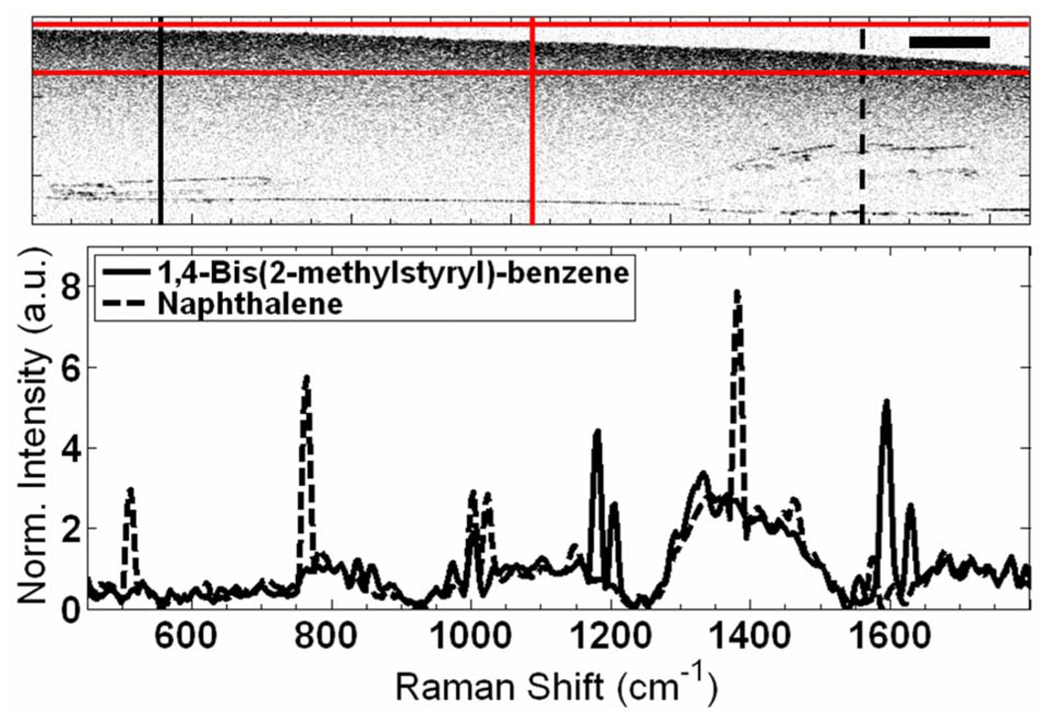
Fig. 2.
(Color online) RS-OCT from a scattering gel with BMSB (solid curve) and naphthalene (dashed curve) showing similarities in OCT but biochemical differences in RS. Scale bar is 0.8 mm. An example of the red Raman targeting lines are shown. Scattering in the sample is due to 1 µm polystyrene microspheres, whose spectral contribution can be seen from the common peak at 1001 cm−1.

