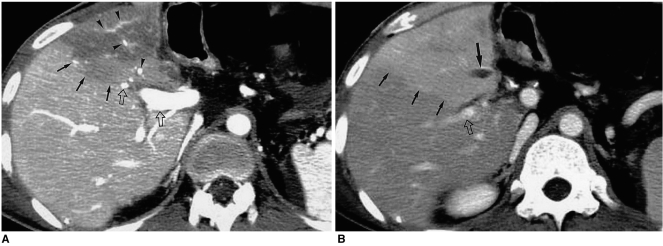
Fig. 2.
Attenuation differences secondary to hepatic vein obstruction in a transplanted liver.
A. CT scan obtained during portal venous phase shows hypoattenuation of the anterior segment of the transplanted right lobe despite normal enhancement of the portal veins (arrowheads) inside the corresponding area.
B. CT scan obtained during the equilibrium phase reveals thrombosed hepatic vein (arrow) which was ligated during surgery. The anterior segment of the transplanted right lobe appears hyperattenuated, producing a negative image of (A). Note that the straight border (small arrows in (A) and (B)) of transient hepatic attenuation difference intersects the portal veins (open arrows in (A) and (B)).

