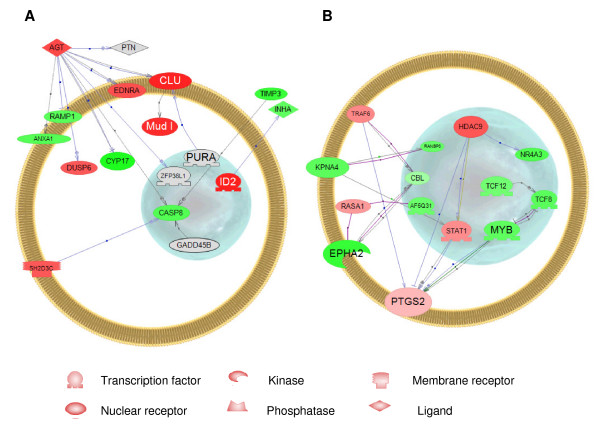
Figure 6.
Pathway Studio analysis. (A) Competitive interactome consisting of genes that are regulated by 5 ng EE2/L and blocked by the mixture of 5 ng EE2/L and 100 ng ZM/L. (B) Non-competitive interactome consisting of genes that are regulated by 5 ng EE2/L but either not changed or enhanced by the mixture of 5 ng EE2/L and 100 ng ZM/L. Red indicates up-regulation, green indicates down-regulation.

