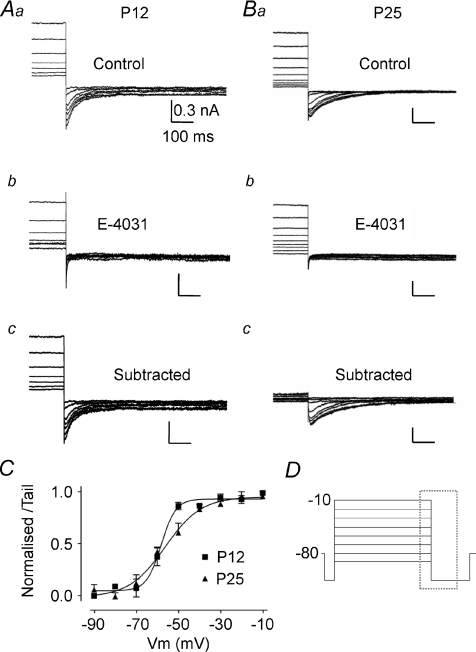
Figure 5. A fast ERG current is activated on depolarisation of MNTB neurons from P12 and P25 mice.
A, data from P12. B, data from P25. For both ages superimposed currents are: control (a); following perfusion of E-4031 (b); and difference current observed by subtraction of a – b (c). All tail currents shown on stepping to −110 mV are activated by prior depolarising voltage steps with high K+ aCSF (20 mm[K+]o, 0.5 mm[Ca2+]o). C, average normalized activation curves for E-4031-sensitive tail currents. Data were fitted with a Boltzmann function giving a V0.5,act of −58.13 ± 1.56 mV with a slope factor of 3.28 ± 0.5 for P12 and a V0.5,act of −56.50 ± 2.08 mV and slope of 8.61 ± 1.98 for P25 animals. D, voltage protocol for A and B; displayed currents occur within the dashed box. All scale bars correspond to values in Aa.

