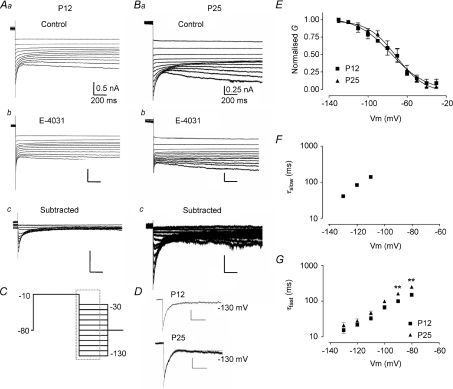
Figure 6. Deactivation of ERG currents from P12 and P25 mice.
A, data from P12. B, data from P25. For both ages superimposed currents are: control (a); following perfusion of E-4031 (b); and difference current observed by subtraction of a–b currents at each voltage (c). All tail currents are shown following prior depolarising voltage steps to −10 mV with high K+ aCSF (20 mm[K+]o, 0.5 mm[Ca2+]o). C, voltage protocol for A and B; displayed currents occur within the dashed box. Scale bars for A correspond to values in Aa, and for B to Ba. D, exponential fits for current decay at −130 mV for P12 and P25 mice. A double exponential was required to fit P12 data whilst P25 data was best fitted by a single exponential. E, quasi steady-state inactivation curves constructed from chord conductances normalised to the peak chord conductance. Boltzmann function fits gave a V0.5,inact of −76.12 ± 3.58 mV with a slope factor of 17.70 ± 4.26 for P12 and a V0.5,inact of −70.77 ± 2.77 mV and slope of 14.71 ± 2.87 for P25 animals. F and G, semi-logarithmic plots of deactivation time constants. For P12 mice, decay currents between −130 and −110 mV were fitted with a double exponential whilst a single exponential function was used between −100 and −80 mV. Currents recorded from P25 animals were fitted with a single exponential at all voltages and displayed significantly slower deactivation rates at −90 and −80 mV compared to P12 animals (2-way ANOVA, **P < 0.01).

