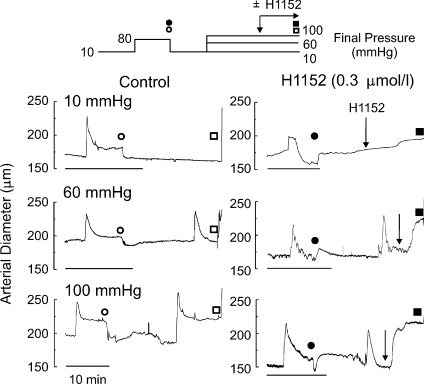
Figure 5. Pressure protocol and representative diameter recordings of arteries used for analysis of MYPT1 and LC20 phosphorylation.
Representative diameter measurements for a two-pressure-step protocol (top) with common step of 10 to 80 mmHg followed by a step to 10, 60 or 100 mmHg in the absence (Control) or presence of 0.3 μmol l−1 H1152 prior to flash-freezing. Scale bars indicate 10 min. Open and filled circles/squares indicate times for diameter measurements in control and H1152 segments, respectively; circles for 80 and squares for 10, 60 or 100 mmHg. CPI-17 analysis used a similar protocol, but tissues were flash-frozen after 3 min at 10, 60 or 100 mmHg. Arrows indicate time of H1152 addition.

