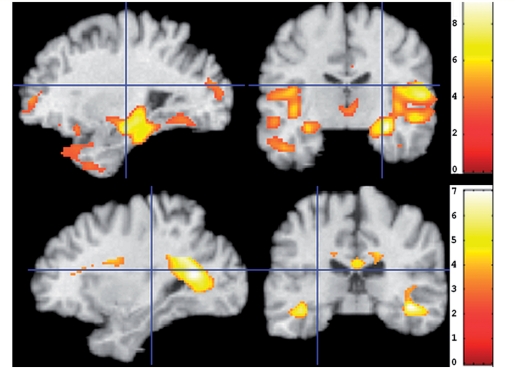
Figure 2.
The t-statistic voxel-wise maps of RAVENS grey matter (top) and white matter (bottom) comparing the 75% of CN individuals with the lowest SPARE-AD scores (CN-like CN) minus those with the top 25% SPARE-AD (relatively more Alzheimer's disease-like CN). The images are in neurology convention, so left in the image is the left brain hemisphere.

