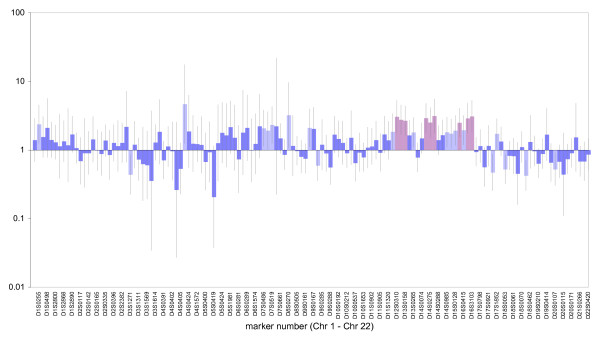
Figure 2.
Odds ratios and 95% confidence intervals for mortality and homozygosity by marker, adjusting for age. Age-adjusted odds ratios (with 95% confidence intervals) of mortality at each locus. All markers were tested for significance using a chi-squared test based on a simple 2 × 2 contingency table (case/control vs homozygotes/heterozygotes). ORs shown in dark blue are non-significant. ORs shown in pale blue are significant at P < 0.05 and ORs shown in pink (n = 9) are significant at P < 0.00037 (i.e. significant experiment-wide at P < 0.05).

