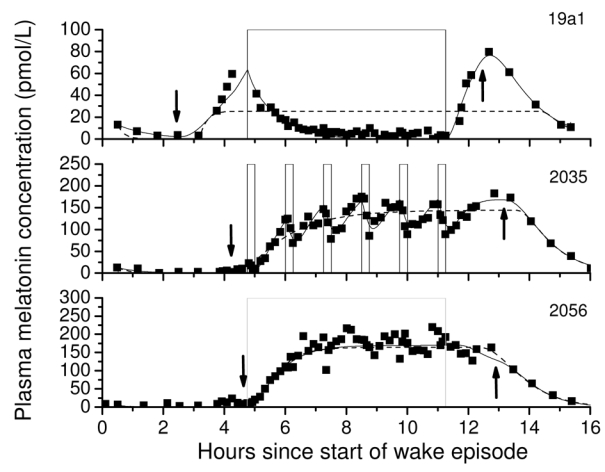
Fig. 2.

The melatonin concentration of a subject exposed to a 6.5-hr continuous bright light (CBL) pulse (top panel, ~9500 lux), six 15-min intermittent bright light (IBL) pulses during a 6.5 hour interval (middle panel, ~9500 lux pulses separated by 60-min of <1 lux) and a 6.5-hr continuous dim light (VDL) pulse (bottom panel, <1 lux) compared to the model with the effect of light suppression incorporated (solid lines) and without (dashed lines). Arrows pointing down indicate when predicted SynOn occurs and arrows pointing up indicate when predicted SynOff occurs.
