
Fig. 3.
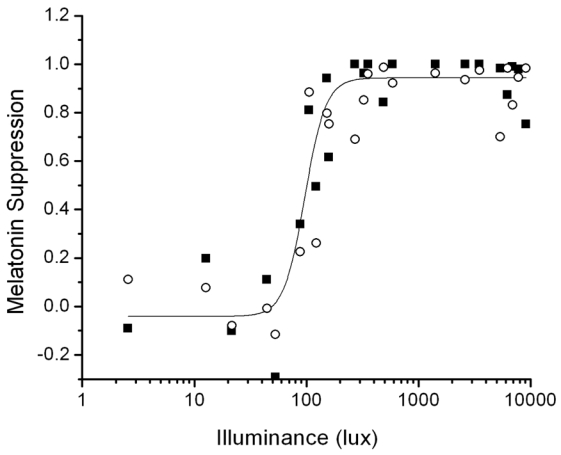
Predictions of the 1 Pulse Intensity Response Curve protocol (filled squares) fit by a 4-parameter logistic function (solid line) compared to the experimental data (open circles).
Official websites use .gov
A
.gov website belongs to an official
government organization in the United States.
Secure .gov websites use HTTPS
A lock (
) or https:// means you've safely
connected to the .gov website. Share sensitive
information only on official, secure websites.
Predictions of the 1 Pulse Intensity Response Curve protocol (filled squares) fit by a 4-parameter logistic function (solid line) compared to the experimental data (open circles).