
Fig. 5.
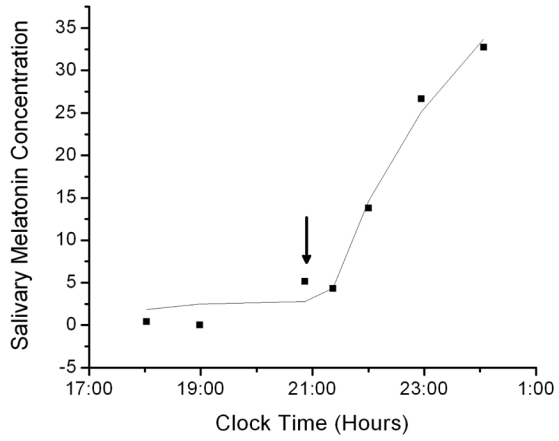
The salivary melatonin concentration in a blind subject in which data from the rising portion of the curve only was available fit by the salivary melatonin model with a fixed SynOff value equal to the time of the last recorded concentration. For these data, the fit had R2 = 0.983 and AIC = 18.912. Arrows pointing down indicate when predicted SynOn occurs and arrows pointing up indicate when predicted SynOff occurs.