
Fig. 6.
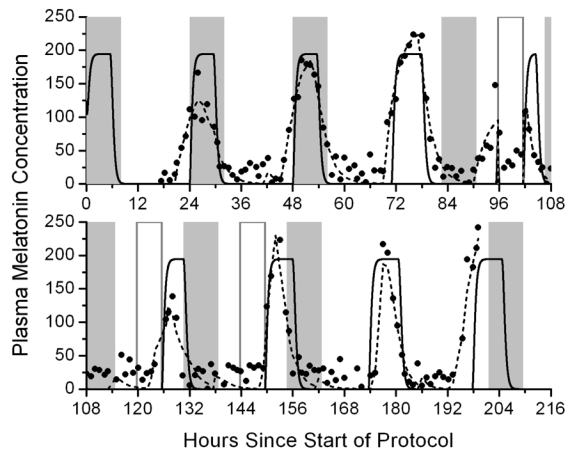
Predictions of the plasma melatonin concentration (solid line, based on average parameter values in the melatonin model equations) in response to a 3-pulse phase resetting protocol. Filled squares indicate measured melatonin concentrations and dashed lines indicate best-fits to the experimental data. Gray bars indicate when scheduled sleep occurs. Open bars indicate scheduled bright light exposure.